Note
Access to this page requires authorization. You can try signing in or changing directories.
Access to this page requires authorization. You can try changing directories.
This tutorial shows how to use a Jupyter notebook to interact with Power BI and detect relationships between tables with the SemPy library.
In this tutorial, you learn how to:
- Discover relationships in a semantic model (Power BI dataset) using semantic link's Python library (SemPy).
- Use SemPy components that integrate with Power BI and automate data quality analysis. These components include:
FabricDataFrame- a pandas-like structure enhanced with semantic information- Functions that pull semantic models from a Fabric workspace into your notebook
- Functions that test functional dependencies and identify relationship violations in your semantic models
Prerequisites
Get a Microsoft Fabric subscription. Or, sign up for a free Microsoft Fabric trial.
Sign in to Microsoft Fabric.
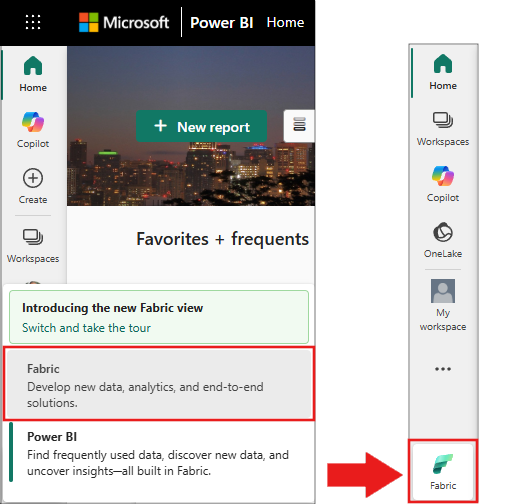
Use the experience switcher on the bottom left side of your home page to switch to Fabric.

Go to Workspaces in the navigation pane, and then select your workspace to set it as the current workspace.
Download the Customer Profitability Sample.pbix and Customer Profitability Sample (auto).pbix semantic models from the fabric-samples GitHub repository, and then upload them to your workspace.
Follow along in the notebook
Use the powerbi_relationships_tutorial.ipynb notebook to follow along.
To open the accompanying notebook for this tutorial, follow the instructions in Prepare your system for data science tutorials to import the notebook to your workspace.
If you'd rather copy and paste the code from this page, you can create a new notebook.
Be sure to attach a lakehouse to the notebook before you start running code.
Set up the notebook
Set up a notebook environment with the modules and data you need.
Install the
semantic-linkpackage from PyPI by using the%pipinline command in the notebook.%pip install semantic-linkImport the
sempymodules you'll use later.import sempy.fabric as fabric from sempy.relationships import plot_relationship_metadata from sempy.relationships import find_relationships from sempy.fabric import list_relationship_violationsImport the
pandaslibrary and set a display option for output formatting.import pandas as pd pd.set_option('display.max_colwidth', None)
## Explore semantic models

This tutorial uses the Customer Profitability Sample semantic model [_Customer Profitability Sample.pbix_](https://github.com/microsoft/fabric-samples/blob/main/docs-samples/data-science/datasets/Customer%20Profitability%20Sample.pbix). Learn about the semantic model in [Customer Profitability sample for Power BI](/power-bi/create-reports/sample-customer-profitability).

- Use SemPy's `list_datasets` function to explore semantic models in your current workspace:

  ```python
  fabric.list_datasets()
For the rest of this notebook, use two versions of the Customer Profitability Sample semantic model:
- Customer Profitability Sample: the semantic model as provided in the Power BI samples, with predefined table relationships
- Customer Profitability Sample (auto): the same data, but relationships are limited to those that Power BI autodetects
Extract predefined relationships from the sample semantic model
Load the predefined relationships in the Customer Profitability Sample semantic model by using SemPy's
list_relationshipsfunction. The function lists relationships from the Tabular Object Model (TOM).dataset = "Customer Profitability Sample" relationships = fabric.list_relationships(dataset) relationshipsVisualize the
relationshipsDataFrame as a graph by using SemPy'splot_relationship_metadatafunction.plot_relationship_metadata(relationships)This graph shows the relationships between tables in this semantic model as defined in Power BI by a subject matter expert.
Discover additional relationships
If you start with relationships that Power BI autodetects, you have a smaller set.
Visualize the relationships that Power BI autodetected in the semantic model:
dataset = "Customer Profitability Sample (auto)"
autodetected = fabric.list_relationships(dataset)
plot_relationship_metadata(autodetected)
Power BI's autodetection misses many relationships. Also, two of the autodetected relationships are semantically incorrect:
Executive[ID]->Industry[ID]BU[Executive_id]->Industry[ID]
Print the relationships as a table:
autodetectedRows 3 and 4 show incorrect relationships to the
Industrytable. Remove these rows.Discard the incorrectly identified relationships.
# Remove rows 3 and 4 which point incorrectly to Industry[ID]
autodetected = autodetected[~autodetected.index.isin([3, 4])]
Now you have correct but incomplete relationships. Visualize these incomplete relationships using
plot_relationship_metadata:plot_relationship_metadata(autodetected)Load all the tables from the semantic model, using SemPy's
list_tablesandread_tablefunctions, then find relationships between tables usingfind_relationships. Review the log output to get insights into how this function works:suggested_relationships_all = find_relationships( tables, name_similarity_threshold=0.7, coverage_threshold=0.7, verbose=2 )Visualize newly discovered relationships:
plot_relationship_metadata(suggested_relationships_all)SemPy detects all relationships.
Use the
excludeparameter to limit the search to additional relationships that weren't identified previously:additional_relationships = find_relationships( tables, exclude=autodetected, name_similarity_threshold=0.7, coverage_threshold=0.7 ) additional_relationships
Validate relationships
First, load data from the Customer Profitability Sample semantic model.
dataset = "Customer Profitability Sample"
tables = {table: fabric.read_table(dataset, table) for table in fabric.list_tables(dataset)['Name']}

tables.keys()
Check primary and foreign key overlap with the
list_relationship_violationsfunction. Pass the output of thelist_relationshipsfunction tolist_relationship_violations.list_relationship_violations(tables, fabric.list_relationships(dataset))The results reveal useful insights. For example, one of seven values in
Fact[Product Key]isn't present inProduct[Product Key], and the missing key is50.Exploratory data analysis and data cleaning are iterative. What you learn depends on your questions and how you explore the data. Semantic link adds tools that help you do more with your data.
Related content
Explore other tutorials for semantic link and SemPy:
- Tutorial: Clean data with functional dependencies
- Tutorial: Analyze functional dependencies in a sample semantic model
- Tutorial: Extract and calculate Power BI measures from a Jupyter notebook
- Tutorial: Discover relationships in the Synthea dataset, using semantic link
- Tutorial: Validate data using SemPy and Great Expectations (GX)


